Rt-Plot 2.8.10.83
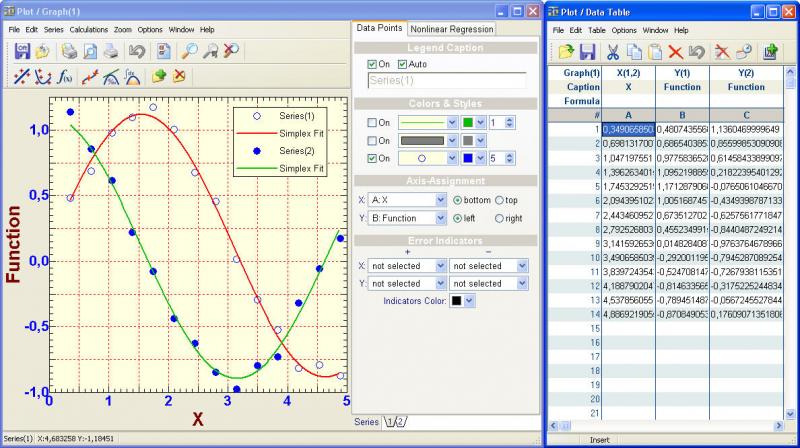
Rt-Plot is a tool to generate Cartesian X/Y-plots from scientific data. You can enter and calculate tabular data. View the changing graphs, including linear and non linear regression, interpolation, differentiation and integration, during entering.
Product Specifications
| User Rating: | item has less then 1 vote |
|
| FileCart Rating | ||
| Submitted by: | horst.reichert | |
| Homepage | Visit Homepage | |
| License | Shareware | |
| Expires | 30 Days | |
| Price | $29.90 | |
| Downloads | 767 | |
| OS Support | Windows Install and Uninstall | |
| File Name | Rt-Plot_setup.exe | |
| File Size | 5.17 MB ( 5,292 KB ) | |
| Published | Oct 24, 2003 (21 years ago) | |
| Updated | Dec 14, 2013 (10 years ago) | |
Follow Us!
Latest Searches
NqVP AND (SELECT 6638 FROM (SELECT(SLEEP(5)))sCJR) UhLw 6 hours ago
NqVP AND (SELECT 6638 FROM (SELECT(SLEEP(5)))sCJR) 6 hours ago
NqVP) AND (SELECT 6638 FROM (SELECT(SLEEP(5)))sCJR) AND (4109=4109 6 hours ago
NqVP AND (SELECT 6638 FROM (SELECT(SLEEP(5)))sCJR) AND Zthp=Zthp 6 hours ago
NqVP) AND (SELECT 6638 FROM (SELECT(SLEEP(5)))sCJR) AND (vrkr=vrkr 6 hours ago
NqVP 6 hours ago
NqVPDDYdXn<">BhsaSY 6 hours ago
NqVP(,).,,.". 6 hours ago
teamviewer portable 7 hours ago
Popular Searches
Database Workbench Pro 258 times
TeraByte Drive Image Backup and Restore 255 times
Elcomsoft Phone Breaker 251 times
Softperfect 233 times
Elcomsoft Phone Viewer 232 times
SAM Broadcaster Cloud 223 times
BootIt Collection 223 times
YetiShare File Hosting Script 207 times
Antamedia HotSpot Software 205 times
Product Details
| Release Info: | Minor Update on Sep 14, 2007 |
| Release Notes: | Intelligent Import, Speedup of file operations |
| Related Tags: | Plot Cartesian Plot Function Plotter X/Y-Graph Graph |
Reviews
You must be logged in to write a review
Reviews of Rt-Plot 2.8.10.83
You can be the first to write a review of Rt-Plot!Most Downloaded Windows Mathematics Software
Logic Minimizer 1.2.1
LaTexMng 2.0
EasyFit 5.0
ABF Value Converter 2.3
Advanced Grapher 2.2
3DMath Explorer 3.1
3D Geometrical Objects 1.4
Calcul 5.2.WIN32
3D Graph 2.12